
Information Visualization
Data Stories That Inspire
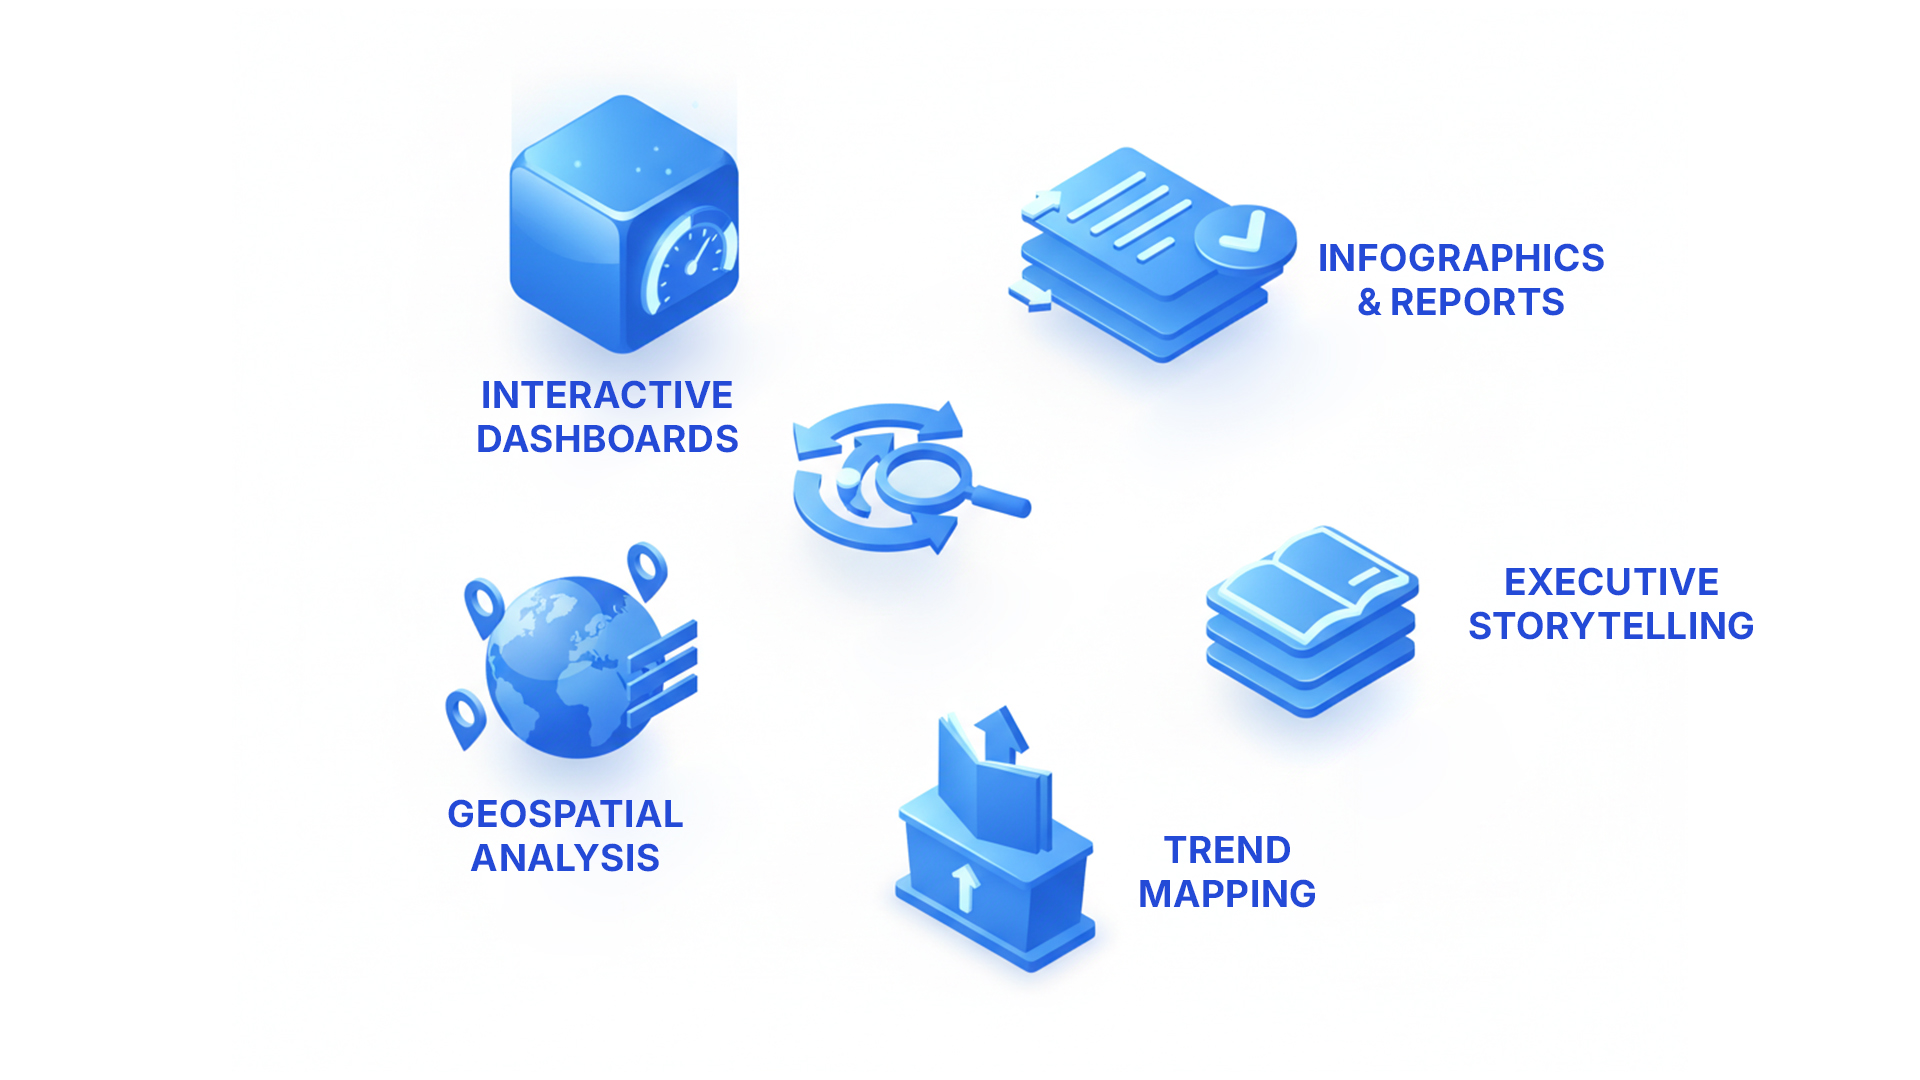
At Yuktiva Insights, we believe that data is only as powerful as the story it tells. Our Data Visualization service turns raw numbers into compelling visuals that drive understanding, inspire action, and elevate decision-making.
Why Yuktiva?
We don’t just report data - we structure, simplify, and visualize information to accelerate understanding and decision-making. Our platform-agnostic approach goes beyond static insight reports to actively support insights, marketing, and product teams. By combining AI-driven automation with expert human interpretation, we deliver visualization-led outputs at scale - enabling speed, consistency, and cost-efficiency across multi-market studies, large datasets, and repeatable intelligence deliverables.